File:Iir-rates.png
Jump to navigation
Jump to search
The printable version is no longer supported and may have rendering errors. Please update your browser bookmarks and please use the default browser print function instead.
No higher resolution available.
Iir-rates.png (500 × 391 pixels, file size: 141 KB, MIME type: image/png)
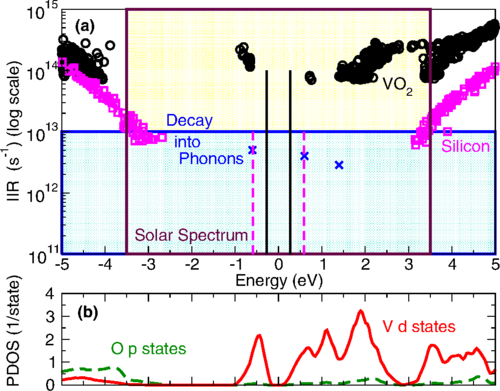
Impact ionization rates in VO_2 and Si. Note the marked (fuchsia) region for solar spectrum, the lines representing band gap for VO_2 and Si. The region with multiplication rates dominated by decay into phonons is also highlighted in blue, blue ticks mark recent calculations of phononic rates.
The bottom part of the image shows VO_2 density of states.
File history
Click on a date/time to view the file as it appeared at that time.
| Date/Time | Thumbnail | Dimensions | User | Comment | |
|---|---|---|---|---|---|
| current | 14:34, 3 November 2014 | | 500 × 391 (141 KB) | Bodrog Zoltan (talk | contribs) | Impact ionization rates in VO_2 and Si. Note the marked (fuchsia) region for solar spectrum, the lines representing band gap for VO_2 and Si. The region with multiplication rates dominated by decay into phonons is also highlighted in blue, blue ticks m... |
You cannot overwrite this file.
File usage
The following page uses this file: